NZTA: 30% More Find PT Attractive
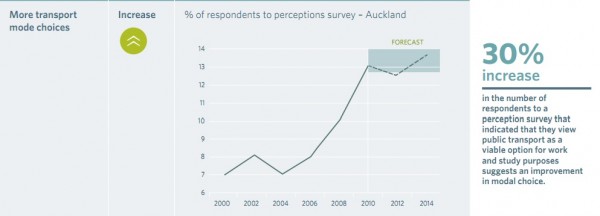
30% more people think public transport is a viable option, according to the NZTA in its just published annual report.
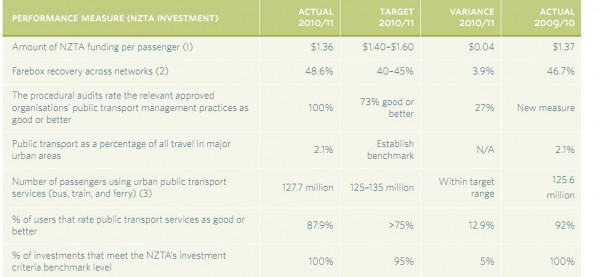
Public transport services performed below budget. Expenditure in 2010/11 was $15.4 million less than budget.
Areas where there was significant under claim include:
- Bus service contract savings at $10.7 million, primarily in Auckland and Wellington
- Total mobility operations $2 million
- Public transport service management $1.7 million.
For Auckland, savings of over $4 million in bus services relate to savings from 2009/10 being carried forward into 2010/11, a lower indexation rate leading to a lower than expected cost base for the year and some planned service changes not taking place during the year.
Wellington’s savings in bus services of almost $5 million are due to significant savings experienced in the new Hutt Valley contract that is now in place.
NZTA lists spending on public transport infrastructure as facilitating more transport choices in urban areas.
“It enables better use of existing transport capacity, helps to ease congestion, aids transport system resilience and security and provides for one of the safest transport modes” but it adds that rail infrastructure is generally excluded from this activity class as the intention is to fund this outside the National Land Transport Fund.
From a financial perspective, public transport infrastructure performed close to, but under budget. Good progress has been made in NZTA costs with the $242,000 variance from budget resulting mainly from efficiency savings in the consultancy spend.
Nationally, the NZTA invested $31.5 million across the country in public transport infrastructure. Of this, 62% was in the Auckland region, 21% was in Wellington, with the remainder in other regions.
End of year expenditure is $13.1 million less than the public transport infrastructure allocation. At 29%, this is considered “reasonably significant.”
“However, it is more closely aligned to the allocation set than in previous years for this activity class.
“Key reasons for the variance are projects not progressing at a pace planned in the cash flows assigned – this is especially true for the Christchurch Bus Exchange, which is not now expected to be considered for construction within the current NLTP.”
Consultancy for technical solutions and tools for Auckland’s integrated ticketing make up around 5.8% of the total public transport infrastructure budget. Using fewer consultants saved $240,000.
The report contains discussion of the new thinking around of funding public transport.
In March 2011, the funding assistance rate (FAR) for passenger rail decreased from 60% to 50% reallocating funds to reflect increased demand for bus services over the course of the 2009-11 NLTP.
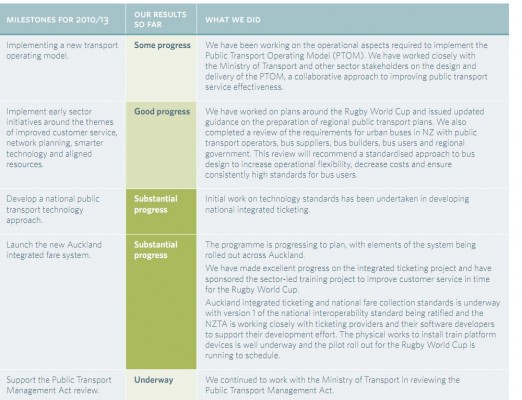
The Ministry of Transport, NZ Transport Agency, the Bus and Coach Association and three councils developed and began implementing a new Public Transport Operating Model (PTOM).
“The introduction of PTOM represents a fundamental shift in the delivery of urban bus and ferry services. The PTOM has sought to improve value for money in public transport services by using a package of planning, funding and procurement tools that encourage increased commerciality of those services and their efficient pricing.
Under PTOM, public transport services that form part of the region’s urban public transport network are grouped together into units and are provided under contract with the regional council to enable stronger network coordination and a basis for joint investment.
Nationally the NZTA says it invested $31.5 million in public transport, with 62% in the Auckland region and 21% in Wellington, with the remainder in other regions.
Key investments were:
- Auckland integrated fare system constructionand implementation
- Manukau Transport Interchange and city rail link
- Real-time system extension (Auckland passenger rail)
- Real-time system construction/implementation (Wellington bus network).
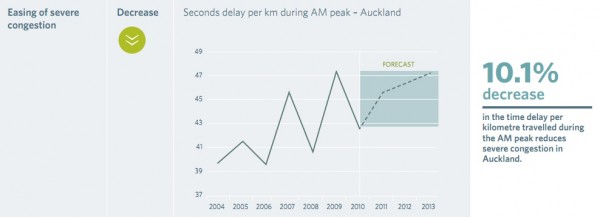
On Auckland roading it suggests severe road congestion in Auckland has eased by 10%:
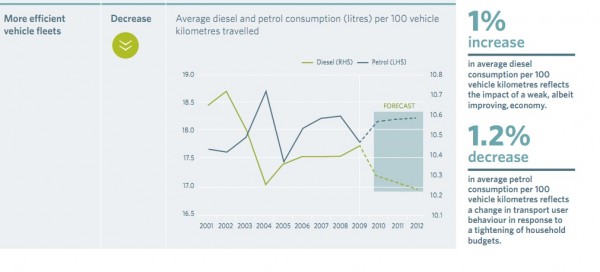
And it suggests diesel use is up just over 1% and petrol down by around the same because of households tightening their budgets in tougher financial times.
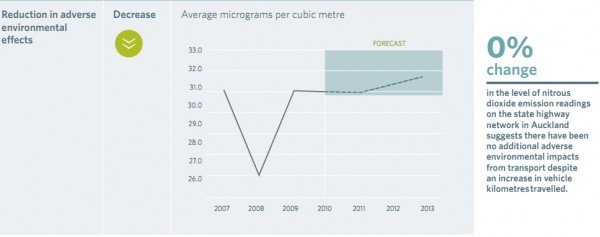
But it insists pollution in Auckland hasn’t changed:
NZTA has ended the financial year with a net deficit of $34.69m compared to a prior year surplus of $13.63m because of storm damage and the Canterbury quake..
For the most part, maintenance activity expenditure performed close to budget. However, the overspend in emergency reinstatement due to the Canterbury earthquakes and other events meant that total expenditure was 6% over budget.
Main points from its annual report:
- Its operating income was $75.4 million lower than in 2009/10 as “we used a larger share of the funds available to accelerate our investment in the state highway capital improvement programme.”
- Its operating expenditure was $27 million lower than in 2009/10 due to less expenditure on maintaining and operating the state highway network and a lower write-off of state highway assets due to the level of capital renewal works undertaken.
- The total value of assets is $434.6 million higher than in 2009/10 because of an increase in investment in the state highway network and other assets, such as the integrated ticketing system.
- Capital expenditure was $84.1 million higher than in 2009/10 because of the continued acceleration of investment in highways
- 55% of large project expenditure in 10/11 was on RONS
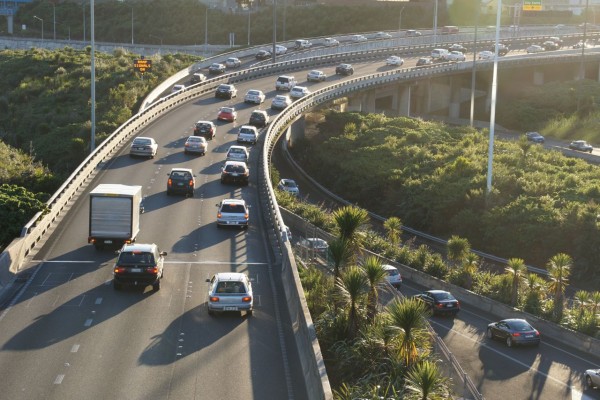
TRAFFIC: NZTA's prioritiy was RONS
“We have actively built a collaborative approach to planning in both the public transport and freight sectors through bringing the key players together to establish the requirements for transport services and inter-modal connections for the future, says its Chief Executive.
“We have continued with a balanced approach to the investment programme through the 2009 to 2012 National Land Transport Programme (NLTP) across all land transport modes. We have accelerated expenditure in the state highway improvement activity class to take advantage of the competitive market, and projects being delivered quicker than originally planned.
“Revenue to date has tracked as forecast at the time the NLTP was prepared and we have continued to use the accumulated surplus from the National Land Transport Fund, as planned, to deliver the full land transport programme.”
And yes progress on Puhoi gets a mention:



4 Comments
In the pollution graph-
Why would the nitrous dioxide reading drop by 5 points one year then bounce right back again the next?
The sensor broken for a year?
My guess is that the readings are affected by the number of windy days
I haven’t had time to look through the report yet, but what I see here is extremely problematic. They’re celebrating very minor successes, and celebrating other things which frankly are problems rather than achievements.
Agree, George D. But as so often, we should mainly be blaming Steven Joyce and the MoT. With activity class money so tightly regimented, NZTA can’t really do much to affect what projects get done and which don’t. Admitted, there will be some - maybe even a majority chunk of them - who are quite happy to build roads, but that is because they are steeped in a culture where money and praise goes to the motorway builders. If the general says “march this way”, the troops can’t do but put a brave face on it.
And this general Joyce loves roads heading right towards cliffs, while cost-cutting the ambulance at the bottom too.