Auck’s Bus Service “Worst”
In a new report, Auckland rates the worst quality of bus service of all the regions on the 3 attributes that are arguably the most important of those surveyed, ie overall service, service value for money, service reliability.
For train and ferry users, Auckland’s quality ratings were lower than those for Wellington users in almost all cases.
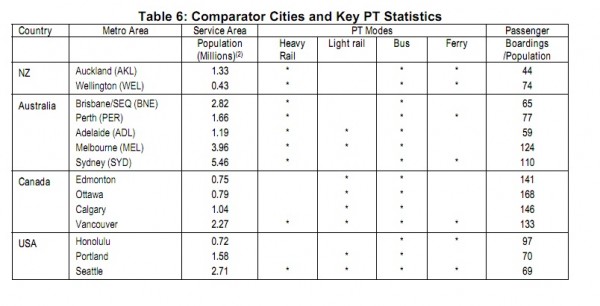
For quality of service, Auckland is well below the figures for the Canadian cities and all the other Australian/NZ cities, and on a par with the typical USA cities.
 These disturbing conclusions are out of a report which includes a combination of traffic monitoring reports for Auckland and goes before Auckland Council’s Transport Committee next week.
- Average fares (per passenger boarding or per passenger km) were highest in the NZ cities, with Auckland’s average fare/pass km around 50% higher than typical average fares in the Canadian/USA cities and around double that in the Australian cities.
- Auckland is one of the few cities that does not have an integrated fares/ticketing system for at least a large proportion, if not all, PT trips.
- On working expenses per Vehicle Km (Cost Efficiency) - For Rail mode, the Auckland cost rate was towards the top end of the range of the seven Australasian cities (exceeded only by Adelaide and Sydney) and 80% above the Wellington rate.
- For Bus mode, the Auckland cost rate was around the middle of the range for the Australasian cities, but significantly above the corresponding rates for diesel bus services in Wellington (and in other NZ centres)
- The historical performance of Auckland’s public transport system over the last 15 to 20 years has generally been lower than 13 other international cities in a benchmark survey in terms of patronage, mode share and overall service
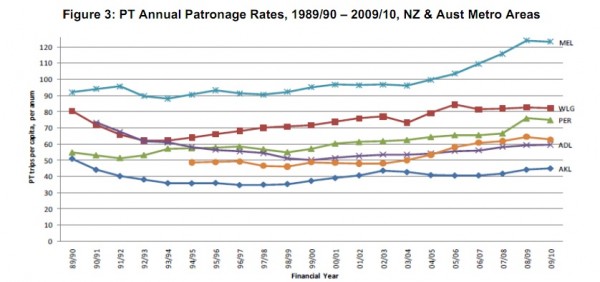
And we are not growing PT as fast as others.
- Auckland’s PT patronage rate is between 25% and 40% below the rates for the 3 medium-size Australian cities with which Auckland is often compared (Brisbane, Perth and Adelaide)
- Auckland’s PT patronage rate has grown significantly over the last 10-15 years, with growth averaging around 1.5% - 2.0% pa (and contrasting with its rapidly declining rate in earlier years). However, this growth has been towards the lower end of the range experienced in other Australian/NZ cities. (Since the study was done, Auckland’s PT patronage grew 8.5% in the 2010/11 year).
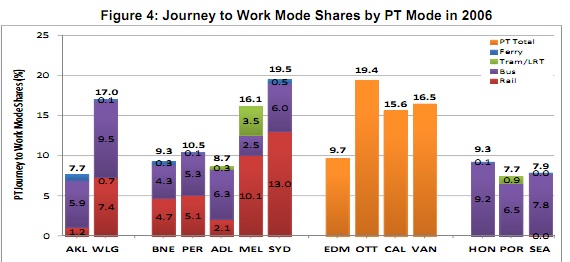
- Auckland’s PT mode share for journeys to work is close to the bottom of the range of all comparator cities.
- Relative to most of the comparator cities, a smaller proportion of Auckland’s PT travel was undertaken on ‘rapid transit’ services.
- Average Vehicle Loadings - For both rail and bus modes, Auckland had the lowest average loadings of all the comparator cities.
- Working Expenses per Passenger Km (Cost Effectiveness) - For all modes combined, the Auckland figure ($0.61) was considerably higher than that for Wellington ($0.33), for all the Australian cities and all the Canadian cities
- Fare Revenue/ Working Expenses - For all modes combined, the Auckland was 39% higher than all the USA cities, higher than all but one of the Australian cities, but lower than all the Canadian cities.
We learn more about Auckland’s travel habits, as recorded in the latest 2011 surveys.
- Auckland’s journey to work mode share was particularly low for trips to the CBD, slightly below the norm for trips to other destinations.
- Over the most recent 15 year period (1991-2006), Auckland’s PT mode share increased significantly for trips to the CBD, but declined slightly for trips to other destinations.
- Auckland’s PT mode share was only ‘substantial’ for trips having one or both trip ends in the CBD.
- Public transport mode share has increased across the isthmus from 13.8 per cent to 14.1 per cent, but decreased slightly across the Central Area from 47.7 per cent in 2010 to 46.4 per cent in 2011.
- Bus patronage into the Central Area has increased by 3 per cent over 2010 levels.
- Ferry patronage into the Central Area has increased by 12.5 per cent over 2010 levels.
- Train patronage into the Central Area has increased by 14 per cent over 2010 levels.
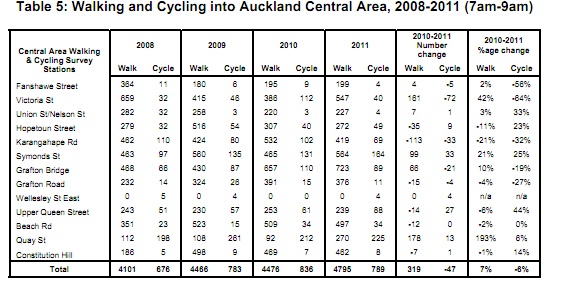
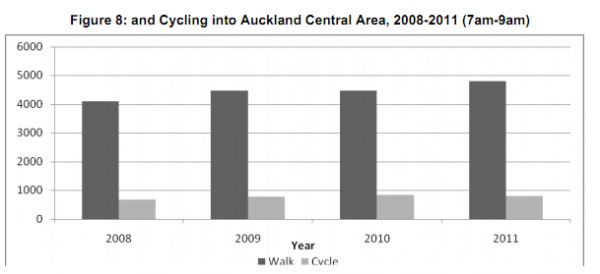
- The number of people walking into the Central Area has increased 7 per cent over 2010 levels, but the number of cyclists has decreased by 6 per cent.
- Traffic congestion on Auckland’s general road network and the road freight network has generally been decreasing since 2009. However, congestion in the evening peak period has been increasing since 2009.
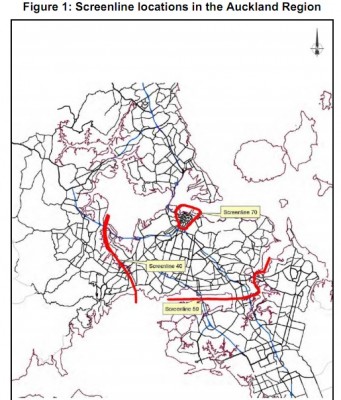
This from various surveys. he 2011 Central Area and Isthmus Screenline Transport Survey focuses on bus, train and ferry passengers entering the Auckland Central Area on a single day. The Isthmus Travel Mode Survey counts people in vehicles and people in public transport crossing particular areas. (see map below)
- The central area has shown growth of 1035 PT passengers (3.3% per cent) and screenline 50 has increased by 636 passengers (10.8 per cent), while the scren 40 declined slightly by 420 passengers (9.8 per cent). It is uncertain why there was a decrease in public transport trips in the west and officers are investigating this.
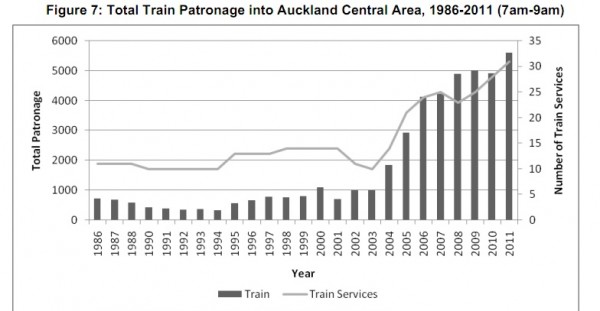
- Train patronage into the central city has remained steady between 2008-2010 but in 2011 a total of 5,603 train passengers were observed disembarking at Britomart Rail Station between 7am to 9am on 30 March 2011. An additional 3 train services (10 per cent increase) has helped increase total patronage levels into the Central Area (685 passengers or 14 per cent increase) over 2010 train patronage levels
- More cars are entering the central area. PT mode share decline in the Central Area is attributed to the increase in vehicle occupancy levels (1.31 persons per vehicle) in private cars entering the Central Area in 2011 compared to 2010 levels (1.26 persons per vehicle).
- A total of 32,382 people were counted entering the Auckland Central Area on PT during the morning peak period of 7am to 9am on Wednesday 30 March 2011. This is 1,035 more PT passengers (3 per cent more) than the 31,347 counted in 2010 This increase reflects the significant investment in PT infrastructure (in the form of the Britomart Transport Centre, rail improvements and the Northern Busway) and the associated provision of additional PT services.
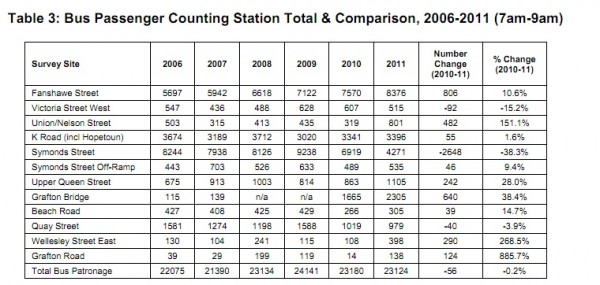
- In 2011, 23,124 bus passengers entered the Auckland Central Area – a very small reduction of 56 passengers (0.2 per cent) on 2010 levels.
- The 2011 survey showed both increases and decreases in patronage at individual counting stations. Many of these changes are significant. Services reaching individual counting stations have fluctuated somewhat this year, as some services have been rationalised while others have been reorganised due to the opening of the Central Transport Corridor.
- Largely because of the Northern Express, Fanshawe Street was identified as the busiest point of entry for bus passengers during the morning peak period into the Auckland Central Area.
- Prior to 2010, Symonds Street was the busiest point of entry during the morning peak period into the Auckland Central Area. In the 2010 survey, the number of bus services along Symonds Street decreased by 13 per cent, resulting in patronage levels falling 25 per cent to 6,919 passengers. In 2011 the bus services decreased by a further 33 per cent, with patronage falling 38 per cent to 4,271 passengers. The decrease in passenger numbers observed at Symonds Street can be largely attributed to the rerouting of buses across Grafton Bridge.
- In 2011, the number of bus services along Grafton road increased by 27 per cent, resulting in patronage levels increasing 38 per cent to 2,305 passengers.
- In 2011, bus services on Karangahape Road and Hopetoun Streets decreased by 16 per cent, however, passenger numbers increased slightly by 55 passengers (1.6 per cent) to 2010 levels.
- In 2011, bus services on Karangahape Road and Hopetoun Streets decreased by 16 per cent, however, passenger numbers increased slightly by 55 passengers (1.6 per cent) to 2010 levels.
- Ferry patronage into the Auckland Central Area has remained relatively stable between 2008- 2010 however, a total of 3,655 ferry passengers entered the Auckland Central Area on 30 March 2011. This is a 12.5 per cent increase (406 additional passengers) from 2010 levels, despite a reduction in ferry services.raffic congestion on Auckland’s general road network and the road freight network has been decreasing since 2009.
- Traffic congestion on Auckland’s general road network and the road freight network has been decreasing since 2009.
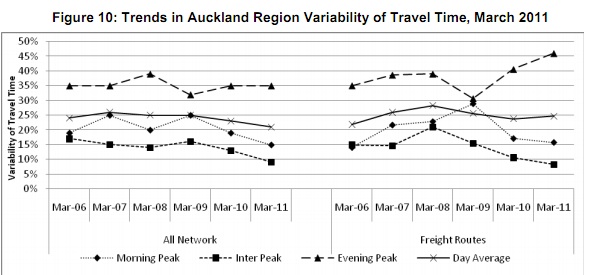
- Traffic congestion in the evening peak period has been increasing since 2009, but the all day average has decreased since 2009.
- Variability of travel time for the morning peak and inter peak have decreased for the entire network and for the freight routes, but has increased for the evening peak.
- So overall, the morning peak and inter peak variability have decreased in 2011 for both the entire network and the freight routes. There has consistently been higher variability in the morning and evening peaks than in the inter peak period. This indicates the effects of peak loading on travel time reliability.
- The highest morning variability was for March 2009, which was influenced by poor weather in the morning peak period for multiple days of surveying.
- The evening peak variability is the highest of all three peak periods and for the all network this has remained consistent relative to March 2010 levels, but for the freight routes, this has increased since 2009. The high variability on the evening peak freight network is due to the motorway network, which is attributed to a number of significant capital works projects on the network:
- Further analysis has identified that the most significant influence on the evening freight variability is the influence of the southbound congestion on the Southern Motorway, and the increase in congestion on Friday relative to other days of the week.



13 Comments
Doesn’t surprise me - Aucklan’s bus system is atrocious.
Anyone surprised?
Integrated fares please. I want to be able to get a monthly/zonal travelcard, and a time based ticket.
I’d like to think this will improve greatly in the future given whats already happening.
Not at all surprised. Do a check on bus stop 8115, which is a busy stop on Great North Rd (Surrey Crescent shops) used by many services and see where they all go to. If you want to go anywhere but Britomart you’re out of luck. Integrated fares will help greatly but the services need to be networked also. Then we might see some uptake.
“On working expenses per Vehicle Km (Cost Efficiency) – For Rail mode, the Auckland cost rate was towards the top end of the range of the seven Australasian cities (exceeded only by Adelaide and Sydney) and 80% above the Wellington rate.”
This can be explained in part by the usurious rates that KR charge AT for LE’s on the SA sets.
Gee what a surprise, who would have seen this coming.
Because of private bus companies competing for the subsidy dollar cooperating with integrated ticketing and being transparent with subsidy demands is the furthermost thing from their minds.
Who looses, the public do.
Fares are way too expensive to compete with the convenience, comfort and privacy of the motor car.
Too many bus routes meander all over Auckland before reaching their destinations instead of going from A to B as quickly as they can. The routes cover off about 5 routes in one at times. Who can be arsed sitting on a bus for 40+ minutes when its less than half the time in a car.
The ferries are too dear as well and unfortunately the trains are catching up in that department.
Get rid of the idiotic model that our bus services run on, lower fares, make buses more direct, sort Britomart out and maybe we will see real progress.
Jennifer, trying to have all buses go in all directions is part of why our bus system is the worst. They’re too spread out and confusing done that way.
In your situation, from Surrey Cres shops, for a start, you don’t have to go just to Britomart, you can get off the bus before then, which will allow you to go directly to K Rd, Aotea/Civic, and Midtown, or switch to the Inner Link towards Newmarket, and if you catch a bus in the other direction across the road, you can either head west or connect with the Outer Link to your onward destination.
Connections will be further improved with integrated ticketing and later the CBD Rail Loop.
Unfortunately, if you use multiple buses to get to your destination, you will be charged separate fares - one for each bus that you use. The result is that passengers get overcharged. As an example, I use two buses to get from my home (Mangere) to work (Mt Albert) on two days a week. I used to use a GoRider card that allowed me to buy a single ticket (5 stages - $6.12) and I transferred to a second bus. Now with the HOP card, I am forced to pay for two separate trips, and the total fare is $7.05 ($3 for 2 stages and $4.05 for 3 stages). If transfers were permitted as before, I would be paying $6 for my trip.
The perversity is that if I was travelling to downtown, I would be permitted to have a transfer ticket - this is also a 5 stage journey.
Since the bus fares are distance based tariffs, the fare paid should not vary based upon the direction of travel. Also, people who are compelled to use more than one bus because of fragmented routes should not be charged more than someone who travels the same distance on a single route.
I believe that the bus system in Auckland may be illegally overcharging the passengers in direct violation of the Transport Act.
I love seeing the look on peoples faces when I tell them it cost me over $10 a day just to get to Uni and back. (Probably more now) For the same distance return trip here it would cost around $2.
@Jennifer: As Andrew mentioned just because all the buses going past a particular bus stop terminates at the same stop doesn’t mean you have less options. There are still the intermediate stops to think about. Sometimes the terminus is the same but the intermediate stops may be different (e.g. Britomart to Glen Innes via Mission Bay [i.e. route 755] or via Eastridge [i.e. route 745]).
@Jonathan: If transfers were permitted under the old GoRider system they are also permitted on the new HOP system according to the FAQ on HOP’s website. Might be worth raising this with the HOP/Snapper people to ask why this is not the case with your particular trip. Hopefully your transfer was actually a permitted/valid transfer and not a case of the rules being bent to accommodate you.
@Andy: Sounds like a Monthly or Day pass would suit you better. Generally (for a 5 day a week student) after 2 stages (or might be 3 stages now with the 40% discount) it’s cheaper to get a Monthly Pass. Of course this assumes you use the same mode of transport all the way.
@Jonathan and probably also @Andy have you not heard of monthly passes?
@James Pole watch this space. I’m creating a network map.
Jonathan has a very relevant point and monthly passes suggested by Andrew would be an expensive option if you travelled infrequently.
What frankly, apart from making the driver’s life easier, is the point of the Hop card if it doesn’t allow you to transfer at no extra cost? If your trip covers two zones that is the fare you should be charged across any part of the city……!!!
@Richard … Stage 1 of Hop was to get NZ Bus hardware on to it, although with their existing fare structure for now. All the integrated stuff is due to kick in mid 2012.
(I personally would have done it the other way around with paper integrated tickets a la Northern Pass, but at least it’s happening)