Who Goes Into The CBD?
I love statistics and trends for transport in Auckland and one annual survey provides some fascinating data.
This year’s is especially interesting because it’s accompanied with trends for the 24 annual surveys commissioned by the ARC as this is its last ever such survey.
So let’s start with one of the interesting statistics. How many people do you think arrive at Britomart at peak time on an average weekday morning?
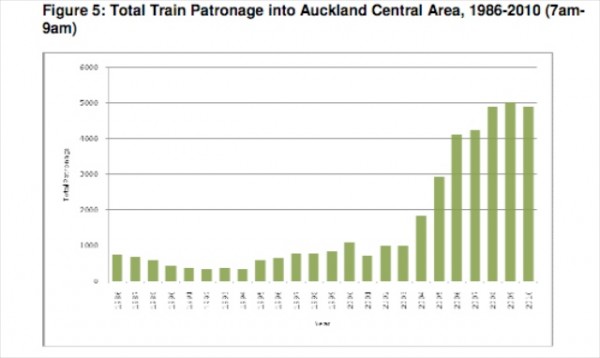
This year’s ARC monitoring exercise found a total of 4918 train passengers were observed disembarking at Britomart train station between 7am to 9am on March 30.
That’s actually a 2% decline (namely 101) on the survey conducted a year before but given the nature of the survey, the reduction is not considered to be significant. And Interestingly, ARTA officers have advised that there has been growth in rail to the CBD outside the peak period.(Timetables and services have got better as have facilities as we know!)
As this data may end up in the discussion around a CBD loop, let’s hope it somehow works for the case for a loop. Of course, one key push for the busines case for the loop is that it will bring more people through the CBD.
Back to the survey - it’s conducted annually for all public transport modes and measures numbers coming in between 7am and 9am on that morning.
This year’s other trends:
- There has been a small (4%) reduction in bus passengers entering the Auckland Central Area at peak times in 2010 when compared to 2009.
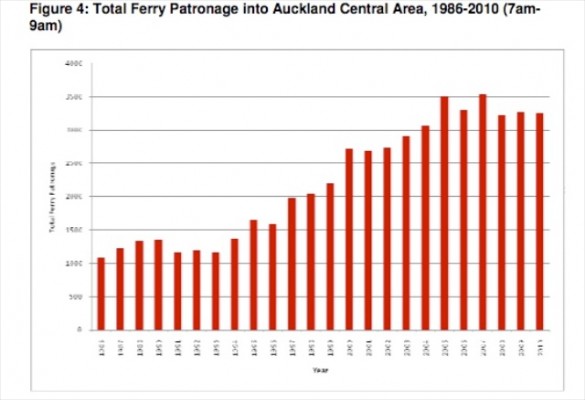
- Ferry patronage into the Auckland Central Area has remained generally stable since 2008 during the morning peak period.
- The number of people walking and cycling into the Central Area has increased since 2008 during the morning peak period.
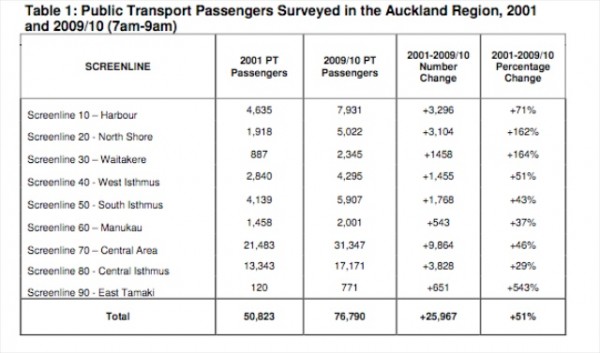
- The Northern Busway has helped increase patronage from the North Shore -and there is also a 543% increase but from a small base from East Tamaki.
Because of the creation of Auckland Transport, this is the last of the surveys from the ARC - which have been done every year for 24 years.
Here are ARC/ARTA’s overall observations over that 24 year period.
- There was a steep decline in both patronage (declined by 44%) and services (bus services declined by 23%) between 1986 and 1994. This decline is generally attributed to the reduction in employment in the CBD (and associated increase in availability of low cost car parking) due to the stock market crash of 1987, and the increasing availability of relatively inexpensive second hand cars imported from Japan.
- Since 1994 patronage for all public transport has increased steadily (by 130% from 1994 to 2010).
- Bus patronage has increased by 92% and bus services by 71% over the period.
- Bus patronage is now slightly higher than in 1986, although with 32% more services.
- Rail patronage has increased dramatically, up by 387 per cent since the opening of the Britomart terminal in 2002 (although off a very low base)
- Ferry patronage growth has also been strong, with an increase of 137% since 1994.
- Average bus loadings in 2010 are now 27 people per bus, 12 per cent higher than in 1994, but 25% lower than in 1986. It should be noted that the cordon counts are not at the maximum load point (southern and eastern services maximum load is at Newmarket for example) so that there is no expectation that average loadings should approach full loads.
- Over the 24 years of the survey, the main entry points to the CBD for buses have been Symonds Street (used mainly by bus routes from the southern Isthmus, South Auckland and Howick/Pakuranga) , Fanshawe Street (North Shore buses) and Karangahape Road (buses from the west).
- Of those main entry points, Fanshawe Street has grown most strongly (147% since 1994) and Karangahape Road least strongly (62% since 1994). It should be noted that the western catchment served by Karangahape Road buses has also seen strong growth in rail patronage.
Now back to this year’s and the specific data on the various transport modes:
Buses:
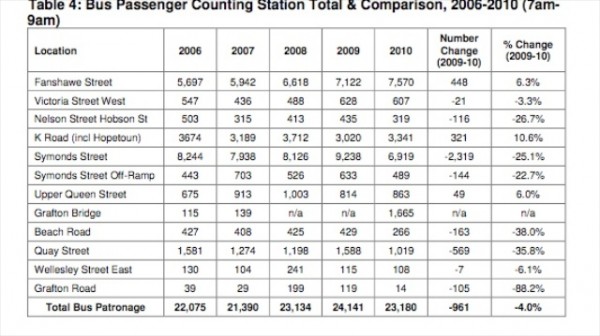
Since the Northern Busway opened in February 2008, the number of passengers entering the Auckland Central Area via Fanshawe Street has increased by 14% to 7,570 passengers. Patronage on Fanshawe Street increased 6% (448 passengers) compared with 2009. This increase in passengers occurred while there was 4% reduction in bus services on Fanshawe Street during the morning peak period in 2010.
From the 2010 survey data, Fanshawe Street was identified as the busiest point of entry during the morning peak period into the Auckland Central Area. This is the first time that Fanshawe Street has had the highest number of bus passengers in the region since monitoring began in 1986.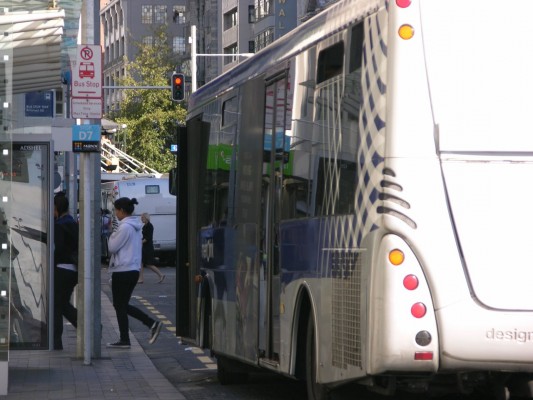
Prior to 2010, Symonds Street was the busiest point of entry during the morning peak period into the Auckland Central Area.
In the 2010 survey, the number of bus services along Symonds Street decreased by 13%, resulting in patronage levels falling 25 per cent to 6,919 passengers.
The decrease in passenger numbers observed at Symonds Street can be largely attributed to the rerouting of buses across Grafton Bridge.
In October 2009, Grafton Bridge was reopened after undergoing structural and strengthening works. The bridge now forms a core part of the central connector public transport route between the Auckland CBD and Newmarket. In 2010, Grafton Bridge recorded 1,665 passengers from 65 bus services. Passengers in services using Symonds Street and Grafton Bridge combined reduced by 7% compared with 2009.
Bus services on Karangahape Road and Hopetoun Streets increased by 9%, resulting in an 11% increase in passengers.
Ferry:
 Overall ferry patronage into the Auckland Central Area has remained stable since 2008. A total of 3,249 ferry passengers entered the Auckland Central Area on 30 March 2010. This is a 0.5% decrease (16 fewer passengers) on 2009 levels.
In 2010, significant ferry patronage increases came from West Harbour (up 33.8% cent) and Gulf Harbour ferry terminal (up 17%), while passenger numbers decreased from Half Moon Bay (down 13%), Waiheke (down 6%) and Pine Harbour ferry terminal (down 4%).
Ferry patronage from the North Shore reversed declines experienced in 2009 with increases in Bayswater (up 6%), Birkenhead (up 15%) and Stanley Bay (up 12%) ferry services.
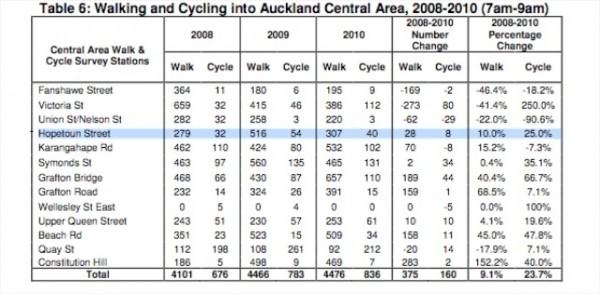
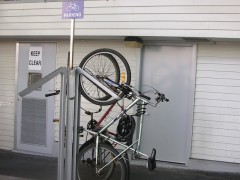
While there have been some fluctuations in the numbers of pedestrians and cyclists at selected survey stations, the overall number of persons walking and cycling into the Auckland Central Area has increased since 2008 (by 9% for pedestrians and 24% for cyclists).
Thanks ARC for running such interesting surveys. Let’s hope Auckland Transport continues such exercises and allows us to see it and also digest it.



0 Comments
You can be the first one to leave a comment.