PT Numbers Leap: Feb Rail Up 17.9%
Auckland public transport patronage has recorded its highest 12-month patronage total since the 1950s and it is the first 12-months to exceed 64 million passenger trips.
For the first time one million journeys were reached on rail in one month.
Public transport totalled 64,075,606 passengers for the 12-months to February - an increase of 4,915,341 boardings -an 8.3% increase.
- Rail 12-month patronage was of 9.2 million with a growth in February 2011 compared to February 2010 - a massive 17.9% increase
- Total Bus patronage exceeded 50 million passenger trips for 12-months to February 2011
- Northern Express bus service carried 1.97 million passenger trips for the 12-months with a growth in February 2011 compared to February 2010 of 20.7% per cent
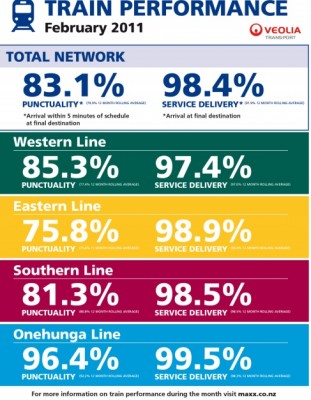
But rail is still not delivering as well as it should. Of the 7,585 timetabled rail services for February 2011 98.4% arrived at their final destination but only 83.1% were on time or within 5 minutes of schedule.
Rail patronage totalled 9,223,040 passengers for the 12-months to February 2011 - an increase of 1,095,364 boardings or a 13.5% increase. This gives you an idea of things heading UP.
For the financial year-to-date, eight months to February 2011, rail patronage has grown by +14.0% (744,000 boardings) .
Western Line rail patronage totalled 3,215,283 passengers for the 12-months to February 2011 an increase of 356,332 boardings or +12.5%.
- For the financial year-to-date, eight months to February 2011, patronage has grown by +15.2% (281,792 boardings).
- Patronage for February 2011 was 305,208 boardings, an increase of +25.6% (62,246 boardings) on February 2010.
Southern and Eastern Line rail patronage including the Onehunga Line totalled 6,007,757 passengers for the 12-months to February 2011 an increase of 739,032 boardings or +14%.
- For the financial year-to-date, eight months to February 2011, patronage has grown by +12.6% (462,208 boardings).
- Patronage for February was 532,780 boardings, an increase of +13.9% (65,063 boardings) on February 2010
- In February there were 478,000 passengers recorded travelling on the Southern and Eastern Lines excluding the Onehunga Line, an increase of 2.3% on February 2010.
- There were 55,000 passengers recorded using the Onehunga Line during February.. For the year-to-date since the inception of these services in September 2010 there have been 262,000 passengers recorded on Onehunga Line services.
Of the bus services, Northern Express continues to be the star.
- Northern Express patronage totalled 1,968,085 passengers for the 12-months to February 2011 (Figure 11) an increase of 297,753 boardings or +17.8%.
- For the financial year-to-date, eight months to February 2011, patronage has grown by +16.3% (176,655 boardings)
- Patronage for February 2011 was 158,646 boardings, an increase of +20.7% (27,182 boardings) on February 2010
Other bus patronage totalled 48,221,816 passengers for the 12-months to February 2011 - an increase of 3,364,870 boardings or +7.5%.
- For the financial year-to-date, eight months to February 2011, bus patronage has grown by +8.4% (2,398,195 boardings).
- Patronage for February 2011 was 4,042,898 boardings, an increase of +7.3% (275,603 boardings) on February 2010.
Ferry patronage totalled 4,662,665 passengers for the 12-months to February 2011 an increase of 157,354 boardings or +3.5%.
- For the financial year-to-date, eight months to February 2011,ferry patronage has grown by +4.4% (134,463 boardings).
- Patronage for February 2011 was 474,891 boardings, an increase of +12.6% (53,312 boardings) on February 2010 .Some of this growth is being attributable to an additional weekday afternoon return sailings at Pine Harbour.
Auckland Transport says rail service on-time performance recovered “to some degree” during February after a significant decline over December/ January when there was a considerable volume of network upgrade work that led to residual speed restrictions and infrastructure faults. Following the Anniversary Day network closure at the end of January most of the speed restrictions were lifted resulting in an immediate improvement in service performance.
However track protection measures associated with the signal upgrade work had an ongoing detrimental impact on Eastern Line services in particular.
 In February 83.1% of all services arrived at their destination within five minutes of their scheduled time, compared to 69.0% in January 2011 and 67.9% in February 2010.
Total rail service delay minutes fell in line with the improved performance in February 2011 (Figure 18). Even though there were 52% more services in February than were operated in January, the delay minutes fell by 25.9% to 14,047. The greatest change was in the level of delay minutes attributed to infrastructure faults which reduced by 40%.
The following major incidents impacted on service delivery during February:
Track, Signals and Train Control
- On the morning of 3 February two successive signal faults, one being a fault with a signal and the other a computer fault, occurred at Britomart that affected all train arrivals and departures for a period between 8.00am and 10.00am.
- During the evening peak of 7 February a communications failure to Network Control in Wellington caused a signal outage at Westfield leading to significant service disruptions, mainly to Southern and Eastern Line services, but with consequential impacts on the Western and Onehunga Lines.
- The following day a points failure at Morningside caused disruption to evening peak services on the Western Line.
- On the morning of Sunday 13 February a signal outage at Henderson caused delays and cancellations to Western Line services.
Train faults
- On 8 February a train fault at Sturges Road Station caused disruption to mid-afternoon services on the Western Line.
- During the morning peak of 11 February a freight train broke down at Papakura causing a temporary block-of-line leading to delays to Southern and Eastern Line services.
Causes of delays
Signal / point failures were the biggest cause of delays (32.4%), followed by track protection measures (31.9%), speed restrictions (27.1%) and network control (8.6%).


22 Comments
Incredible - the numbers are there, now how about equivalent increases in funding as opposed to the endless increases in motorway spending despite falls in motorway traffic.
Great to see. I’m looking forward to the March stats as the trains seem packed at the moment.
Oh and for Feb it put rail trips at 30k per day including weekends which is more than the bogus 27k that John Key claimed use P2W daily (remember the govt claims P2W is more important than the CBD tunnel as more people use it)
Onehunga has ~2000 boardings per day during Feb then. With such good on-time performance, that should only increase.
Great news on the steady increases with overall up 8.3% on the last 12-months, that continues to sit well above population growth during the same period. Aucklanders are getting out of our cars, we don’t have a “love affair” with them and just need decent alternatives as this data continues to show.
And yet Joyce will continue to cite statistics from 2006 to back up his roading orgy.
This is very positive news for PT in Auckland though. Helped i’m sure by soaring petrol prices. Times are chaning that’s for sure.
Wow so mid 2011 12 month rolling average rail patronage should be roughly double mid 2006!
Makes Joycey’s choice of data from 2006 downright dishonest.
I wonder if once we get to the point where the Auckland rail network is undeniably carrying many more people that the highway if the Nats will change their tune the other way. Somehow I doubt that.
Well get March’s number and get some press happening…. AT please?
What’s even more impressive is that, for much of February, tertiary education is not contributing to passenger numbers in any meaningful way. It’s not until the last week, really, that university students have classes to attend in large numbers.
Ergo, if that 2010-2011 jump is so large and has that proviso, this month is set to be absolutely stellar. I certainly see a million-passenger month as very achievable and realistic, especially with petrol prices showing no signs of abating. I recall the $2.20 price fright in 2008 only lasting for a few days before retreating. Anyone remember otherwise?
Ahh…those were the days. I remember being shocked then. Now it’s like meh. I don’t really care I only drive on weekends $60 every one or two months.
http://www.aa.co.nz/motoring/owning/running-costs/petrolwatch/Pages/June2008.aspx
I wonder how many passengers the “Northern Express” would carry if all the stations had adequate car parking? More than buses could cope with I bet.
Richard, only around 15% of Northern Express passengers park and ride, and the parks have been full since the busway opened so none of the ongoing growth can be attributed to them.
The car parking is almost inconsequential to Northern Express patronage. Putting in more would surely attract more park n riders, but it appears to be totally unnecessary to attract more patrons to the bus.
Great to see these figures. Campbell Live led with the story of Auckland’s PT and trains along with an interview with the mayor during his weekly rail commute. So we’re getting some mileage in general media.
@Joust - Onehunga patronage is recorded at Ellerslie, so includes Southern Line passengers.
True, the CBT should organise public meetings closer to the elections an invite Joyce, as Minister of Everything Including Transport, ..then go through the ACTUAL number of users versus his 5 year old data.
Impressive to see the Onehunga line doing well - thank god for Mike Lee and the Campaign For Better Transport! ARTA was predicting usage of 500 people per day on the Onehunga line - but we all knew they were way off!
Great to see these results — Aucklanders are voting with their feet.
Transport Minister Steven Joyce is burying his head further in the sand if he doesn’t show some support for this city’s critical rapid transport projects instead of his uneconomic motorway building plans…
Nick I think you have misunderstood what I meant regarding the Northern Express and parking. I agree the increase is irrespective of the parking problem.
I have used the bus several times by bus to Smales or car to Constellation and for me living only 2kms from Smales Farm the trip home seems to always be one that just misses the local bus meaning the trip that takes ten minutes off peak by car takes nearly an hour by bus!! Incidentally this is nearly half an hour longer than when the bus used to go directly to Victoria Street
I repeat …..if there were satisfactory car parks many more would use the Express
We were told originally it was to be a Park and Ride and this it certainly is not
Richard, instead of spending millions building more car parks wouldn’t it be better, easier and cheaper just to align the local buses and improve their frequency so you don’t just miss the connection?
Amazing things are happening here - Aucklander’s getting out of their cars!
The Northern Express has had people standing right to the front of the bus when I`ve seen it pass me on Fanshawe St going in both directions this week at off peak times.
@Jon C where did you get the detailed data from? AT dont seem to have published the minutes/reports on their website yet as they promised the other week.
Luke - it is in the reports section as was up there yesterday afternoon.
http://www.aucklandtransport.govt.nz/about-us/publications/Reports/Pages/default.aspx
Imagine how many more there would be on trains if they ran to time
And how many more again if there was a greater commute time frequency of service?
How do the 7am - 9am actual ridership counts compare to the existing maximum capacity (at current frequencies)? are we at or close to 100%?