Car Claim Doesn’t Ring True
As the business case work for the CBD rail loop nears an end, a report into the state of Auckland City shows encouraging signs of public transport use into the CBD itself.
But the council may be getting selective in its data about how car crazy Aucklanders are by trying to show this means less car travel on Auckland roads.
First the good part.
While Auckland City’s state of the city 2010 report has old data that doesn’t capture the big increases in public transport use this year - a 36-year high - but does show the increase over the years in people opting for public transport to come into the CBD.
Of course, the idea that public transport should begin and end at the CBD because that is where most people work is an old fashioned idea of looking at Auckland but if we are pressing a case for people moving around the CBD using a rail loop, such data is useful.
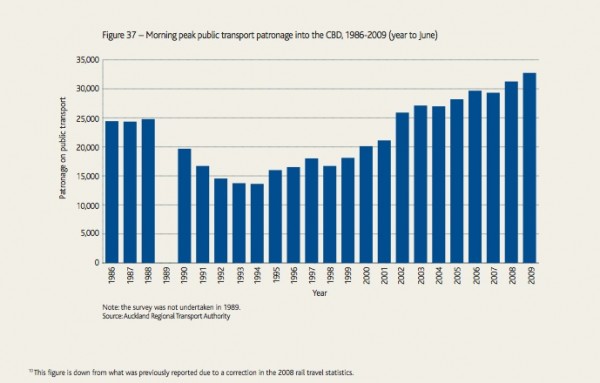
Over 32,747 people used public transport to get into the CBD each morning in 2009, up from 31,26310 in 2008. The report suggests this 5% increase in public transport patronage is mainly attributed to an increase in bus passengers, up six per cent from the previous year. It quotes in the five years to June 2009, public transport patronage increased by 16 per cent, due in part to an increase of over 70 per cent in rail passengers. Bus patronage increased by 12 per cent over the same period.
The part that doesn’t ring true is where the report claims more Aucklanders are getting out of their cars - that claim doesn’t acknowledge other data that has been coming through the last year which suggest that it’s not about vehicle registration totals but the fact Aucklanders are - sadly - using their cars more.
Between June 2008 and June 2009, there were enough cars registered in Auckland city to stretch the entire length of New Zealand if placed end to end but Auckland City boasts there was a 13 per cent reduction in private vehicle registration over the last four years.
I wish the council’s conclusion was true but there’s no visible sign fewer vehicle trips are being made with is a key statistic.
Other reports in the last 12 months have in fact revealed another 35 new vehicles are coming onto Auckland roads each day and the air pollution is getting worse and Kiwis are in love-still- with buying SUVs.
So this feels like just selective data to explain the PT rise.
The ARC report had reported 2 disturbing trends:
- 17% of Auckland households now have 3 or more vehicles compared to 14% just 3 years previously
- In 2077, the average Auckland drove an extra 275k a year compared to 2000. This increased driving distance was in addition to the growth in use of public transport.
But the council mentions none of this and hangs its case on vehicle registrations.
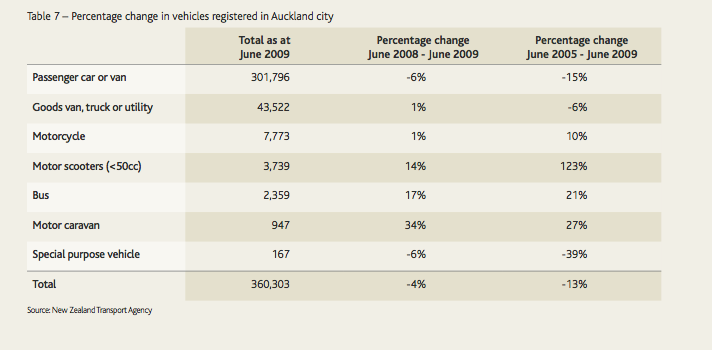
The good news is that in the two years to June 2009, public transport patronage across Auckland city increased, while vehicle registrations decreased. This suggests Auckland city residents are getting out of their cars and using other modes of transport. As at 30 June 2009, there were 360,303 vehicles registered in Auckland city, of which 84 per cent were private cars and vans. This was 13 per cent fewer vehicles than in 2005, and 17 per cent fewer than in 2007.
Table 7 shows the percentage change in vehicles registered across all the vehicle types monitored. The column to the far right, which shows the percentage change in vehicles registered between June 2005 and June 2009, has some interesting results. Passenger car or van registrations (essentially private vehicles) were down 15 per cent. Motorcycle registrations were up 10 per cent and motor scooters a staggering 123 per cent. These figures seem to show a change in private vehicle use, with Auckland residents slowly shifting away from private cars and vans towards more fuel-efficient private vehicles such as motorcycles and mopeds.
Odd facts of interest in the report:
- as at June 2009, bus lanes across Auckland city totalled 32km, 4.5km more than the previous year and 7km more than at June 2005 – mainly attributed to the Remuera Road bus lane and additional bus lanes throughout the CBD
- Last year, each Auckland city isthmus residents used enough water to fill two milk tankers – although this was the lowest recorded consumption since the early 2000s
- Over the past five years, Auckland city’s annual economic growth has averaged 1.4 per cent, which is higher than growth in both the Auckland region and the country
- We’re living longer – the life expectancy of women and men in Auckland city is 83 and 79.6 years respectively
- Between 1981 and 2006, the proportion of smokers aged 15 and over halved
- Auckland city has the most ethnically diverse population in the country
- Auckland city is younger than the rest of the country – the median age is 33.4 years for the city, compared to 35.9 years for New Zealand
- Over the past five years, an average of 16,700 jobs were created in the city, representing a 0.8 per cent increase
- Between 1997 and 2005, Metrowater halved the amount of waste water pollution entering the Waitemata harbour
- Over the five years to December 2008, the number of exceedences of the AAQG (ambient air quality guidelines) has reduced.



8 Comments
I think your blog post is selective too. You’re comparing PT trips into the CBD with the amount of KMs travelled by Aucklanders (presumably) to various places including but not limited to the CBD. It could be that the increase in KMs travelled occured *outside* the CBD and there was actually a decrease of KMs travelled to/from/within the CBD thereby validating the council’s argument!
With the investment in PT it shows in the stats. So with further investment more patronage. “Build it and they’ll use it”. It’s the same with roads. But with more roading investment their would be negative effects like congestion else where and more pollution.
Jon - have a look at this post: http://transportblog.co.nz/2010/08/05/statistics-show-we-are-driving-less/
It suggests that while we may be owning more and more cars, we actually seem to be driving them less frequently. I’m guessing more people are having cars just for the weekend and using PT to get to work/school/uni during the week.
@Jarbury The point I am making is the Auckland City has lazily based their assumption ONLY on car registrations. It’s actually about whether people are using those cars more or less that matters- the point you are making. The ARA report said they are using their cars more.
Interestingly the data I got from ARTA suggested that people are using their cars less.
Can someone please explain what ARTA means when they write: “North-Western Cycleway / Great North was firstly monitored in 2005.”?
like should be compared with like. the data available for public transport is numbers of trips, so should compare against numbers of car trips over time. Fewer new registrations in the period is much more likely due to the fact as mentioned on this blog previously that during the last 2 years the market for new and used vehicles has been such that people are waiting longer to replace their cars than they used to. Registration numbers and trips on Buses Trains and Ferries really have no relation to each other and one should not be used to explain the other.
Can someone please explain what ARTA means when they write: “North-Western Cycleway / Great North was firstly monitored in 2005.”?
ARTA has been running a yearly (one-day only) survey of a number of cycleways and cycle-route important intersections. This is to give an idea of the growth of (commuter) cycle movements through the region.
Last years saw some massive growth, in the double digit percentages per year, though quite different by part of region and of course, local counting site.
ARTA have also started implementing some permanent cycle counters, to get away from the one day only snapshot survey.