
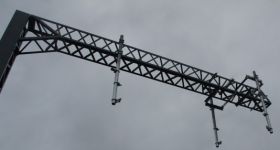
Official: Harbour Bridge Traffic Declining
A new confidential report for the NZ Transport Agency and obtained by AKT shows that both the traffic loadings and volumes on the Auckland Harbour Bridge have declined since 2005.
This report by Beca Infrastructure & Hyder UK is dated September 28, and comes as the Victoria Park tunnel starts being open to vehicles and discussion continues about the need for a further harbour crossing.

AUCKLAND HARBOUR BRIDGE: Fewer not more vehicles using it daily
The report says that the annual average daily traffic counts for the Harbour Bridge showed approximate linear growth from 1960-2005, but then declined recently.
Total heavy traffic volumes have declined since 2007 and, while increasing again, significantly even those numbers are below the long-term trend of 4% compound growth.

A drop in average daily use in 2008 had been attributed to high petrol prices and increased use of public transport assisted by the Northern Busway.
Petrol prices have risen 10c a litre since January .
In this report the daily counts for 2009 - 2010 show only small increases compared to 2008.
The present 2011 long span daytime loading estimates for the extension bridge lanes are close to the estimates that were for lane flows back in 2005.
The report, which seems to try to paint a positive picture, suggests “this reflects neutral overall growth in heavy vehicle content over that period and favouring of the truss bridge lanes during and after the box girder strengthening.”
And the southbound extension bridge afternoon and early morning loads for 20 years growth are both very close to the daytime northbound extension bridge loads based on 2007 data.
This indicates that southbound extension bridge traffic loadings are expected to remain below those used for the box girder strengthening designs provided no substantial change in heavy vehicle mix and weight characteristics occurs.
The report says vehicle counts do vary from month to month.
This shows the variation in monthly average counts over the year to March 2011.

“This illustrates that both counts and average heavy vehicle percentage can vary over the year. For the period shown, the highest southbound heavy vehicle percentage values occurred in September 2010 (4.15%), November 2010 and March 2011 (4.13%). Thus the selection of March 2011 for the current review was considered appropriate.”
Over the past few years, the number of trucks using the southbound extension bridge has been affected by weight restrictions for the strengthening project, but the most recent percentage content data indicates a return to 2007 levels as of May 2011.
 The weight distribution for southbound vehicles has also changed significantly. Recent data shows that although there is still a lower proportion of fully laden trucks in the northbound direction compared to southbound, the southbound volumes of fully loaded truck & trailers have increased recently, necessitating revisions to the current live loading estimates.
For the 5-lane and 3 lane configurations, the change in traffic distribution has led to a decrease in loading but there is a hypothesis raised in the appendix by Hyder as to whether there could in fact be more trucks but that they are more evenly distributed across lanes.
NZTA has indicated that a minimum 20 years of unrestricted legal traffic on the southbound extension bridge must be allowed for to meet its operational requirements for the bridge. This aligns with the anticipated timeframe for the next crossing.
The report says the last graph shows that the 20-year upper growth estimates for the southbound extension bridge are close to the 2007 northbound extension bridge daytime loading and well below the early morning loading.
It speculates that the significant differences between current southbound and 2007 northbound daytime loadings are attributed to:
- Particular types of truck & trailers fully loaded heading North and returning empty. These vehicle types are typical of those used for bulk goods haulage and construction materials.
- Historical lane preferences. Before weight restrictions were introduced for the box girder strengthening, the lanes most favoured by the larger truck classes in the 3 lane configurations were 2 North and 3 South.
And what of the Victorial Park tunnel?
The authors don’t seem to know.
It says the completion of the Victoria Park Tunnel project early next year may affect southbound lane selection and route choice, but “the potential impact on loadings is unknown”.
“In the short term, the completion of the Victoria Park Tunnel may alter the southbound heavy traffic lane usage patterns.
“For the longer term, there is no reliable information available in other studies regarding future heavy freight growth in the southbound direction.
The report believes (or is that the report hopes) the long-term trend is for growth in truck use of the bridge to continue.
It speculates that future changes that could affect the southbound loading on the bridge may include:
- Increases in product manufacturing in the industrial areas North of the bridge.
- Changes in supply sources for bulk aggregates and construction materials to the Auckland region if demand exceeds supply from existing sources.
- Future changes in the vehicle dimensions and mass rule – potential effects on extension bridge loading have not been studied in this investigation. The authors assume that high productivity motor vehicles will not be allowed on the extension bridges due to fatigue life impacts.
- General changes in the heavy vehicle fleet.
The report also looked at the possibility of a future bus southbound priority lane when the Northern Busway is operating at its design capacity (250 buses/hour) and seemed to suggest it could cope but noted the NZTA isn’t even putting this forward as an option. That’s a pity.
So do we still need another harbour crossing?


7 Comments
There can be no doubt that the Northern Bus lanes have contributed to people parking up their cars for a quicker ride into the city, which of course just goes to show that if decent public transport is provided commuters will use it and the city is better off for it.
That and fuel prices being sky-high where even Z (Shell) said this week that they had sold lower volumes of fuel.
Traffic volumes have fallen, I guess we can save $5b on another crossing then
AT have actually been indicating this result for a while now, at the same time the number of people crossing the bridge has increased thanks to the busway. 30-40% of people crossing at peak times are using buses according to them.
Look for the number of heavy vehicles on the bridge to fall even further now construction has finished on the tunnel, because the bridge was heavily used by trucks involved in the construction.
@Evan j — good point, like a tax funded perpetual money making machine for the construction and truck firms if this is used to prop up justification for building another crossing.
“Traffic volumes have fallen, I guess we can save $5b on another crossing then”
Wrong, we need the second harbour crossing to unlock the benefits of the Vic Park Tunnel.
Don’t you folks ever understand how this shell game works?
Ingolfson- You all need to put up your “sarcasm” emoticon or people aren’t going to get it.
Benefits of the Vic Park Tunnel- a third of a billion dollars for extended congestion. We got that benefit unlocked already!
“So do we still need another harbour crossing?”
Yes - but only for trains, cyclists and pedestrians. And turn lanes on the existing harbour bridge into full-time bus lanes